释放双眼,带上耳机,听听看~!
使用 windows_exporter 可以非常方便地给 prometheus 增加监控 windows server 的能力。通常情况下只需使用默认配置就可以监控 CPU,内存,网络,服务了。但某些场合,如服务器安装了安全狗,在某些配置下可能不能获取某些服务的状态,此时就需要自定义配置,比如只监控某些服务。
- 一、下载一键安装包
https://github.com/prometheus-community/windows_exporter/releases/download/v0.15.0/windows_exporter-0.15.0-amd64.msi

#备份下载地址
https://d.frps.cn/file/tools/windows/windows_exporter-0.15.0-amd64.msi
https://d.frps.cn/file/tools/windows/windows_exporter-0.21.0-amd64.msi
https://d.frps.cn/file/tools/windows/windows_exporter-0.22.0-amd64.msi- 二、手动脚本安装
项目地址:https://github.com/prometheus-community/windows_exporter
msiexec /i <path-to-msi-file> ENABLED_COLLECTORS=os,service --% EXTRA_FLAGS="--collector.service.services-where ""Name LIKE 'sql%'"""
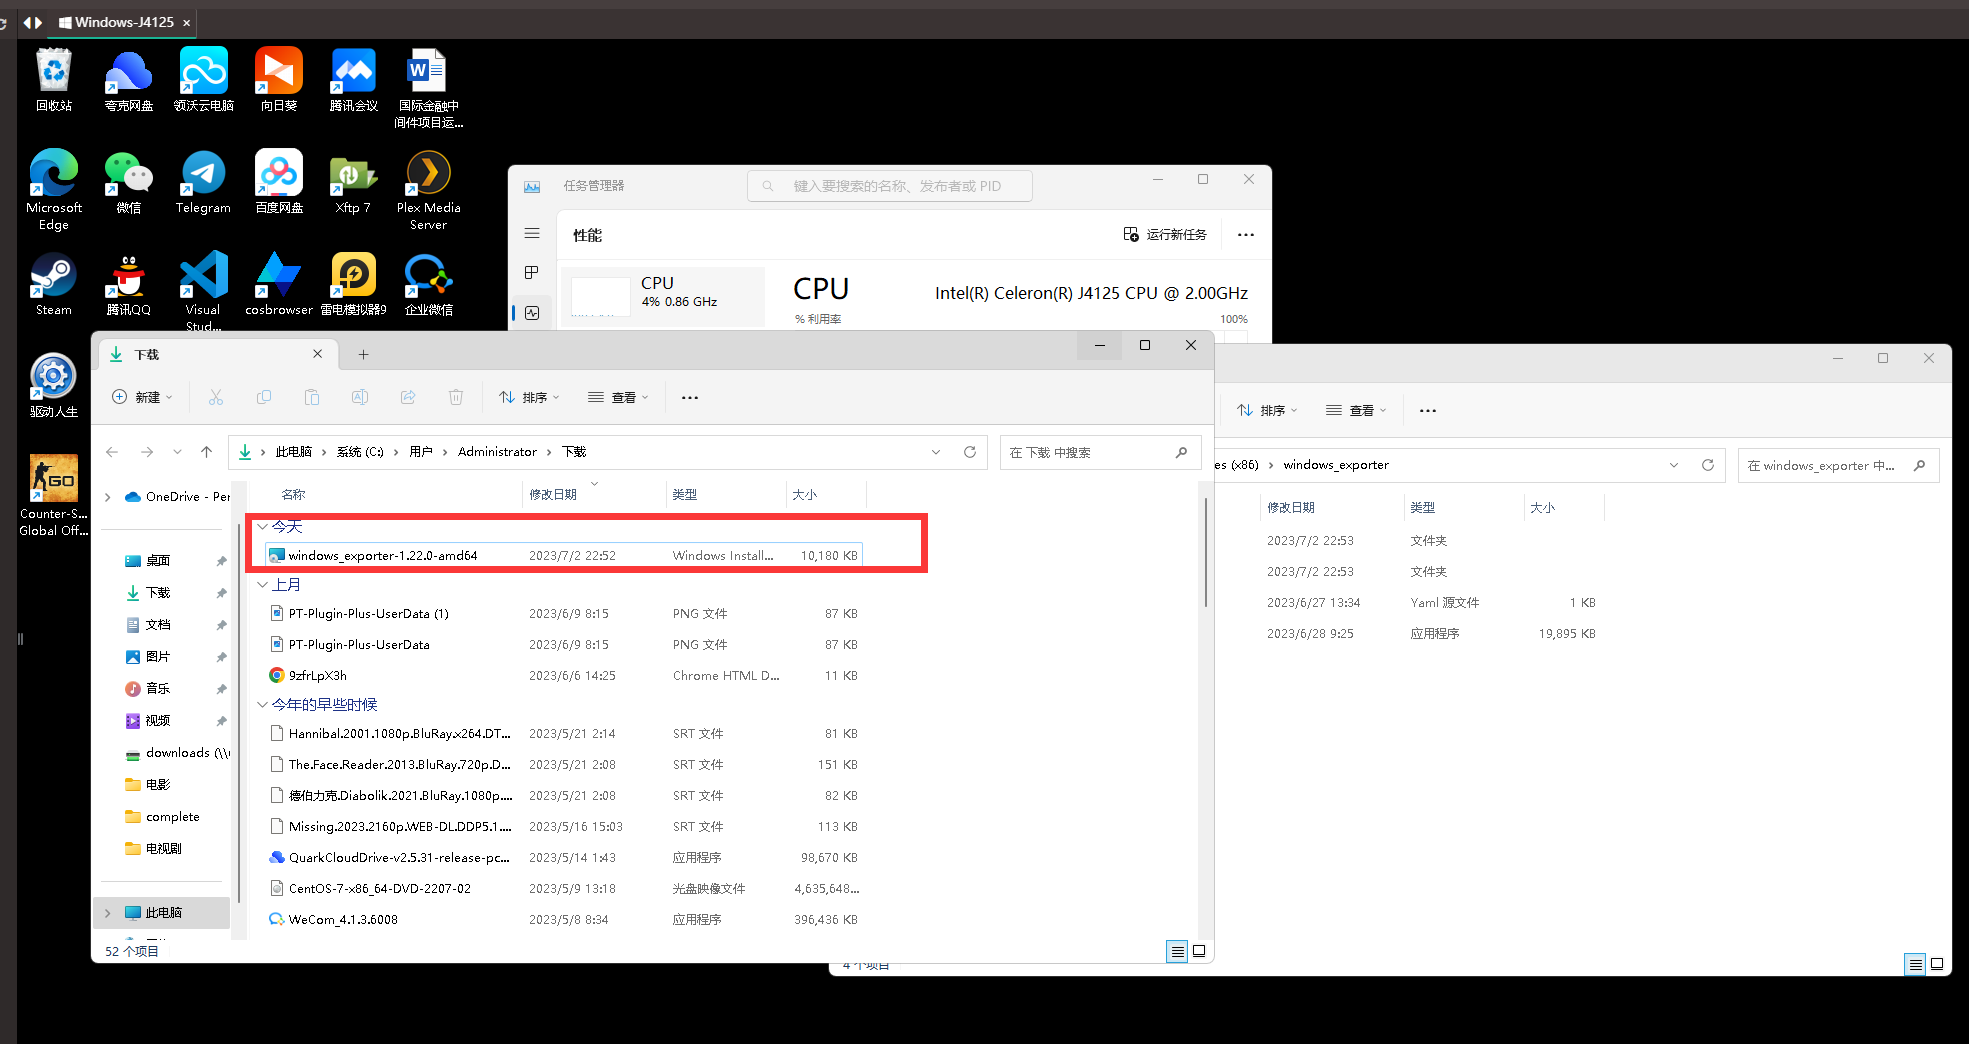
#自行修改路径官方提供了软件包的方式,这里我采用软件包进行安装部署
双击安装软件包
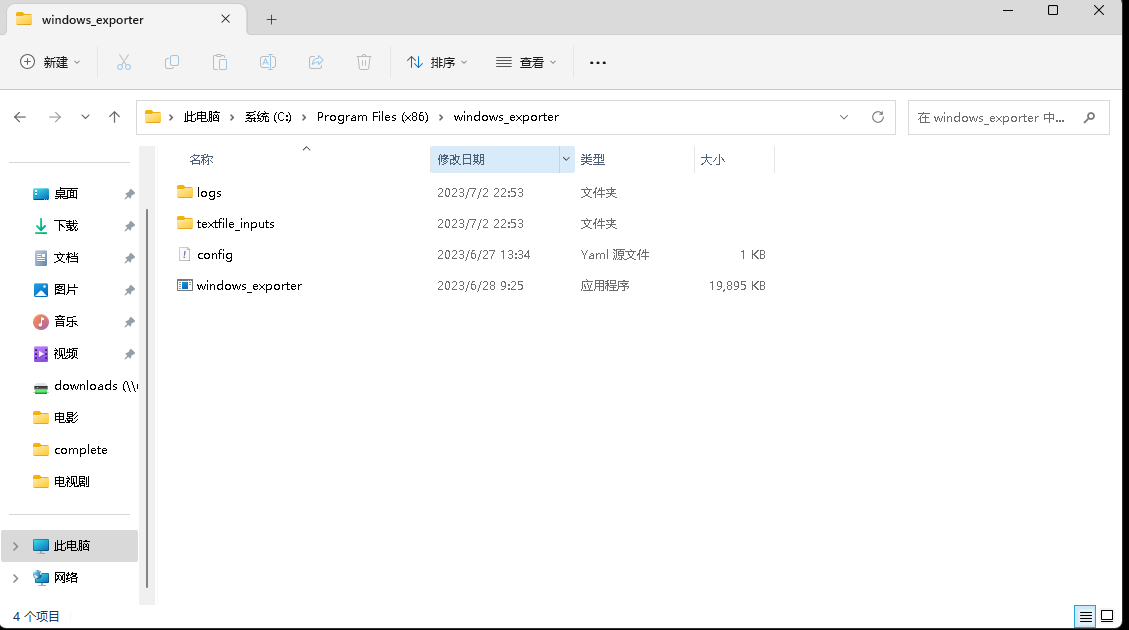
- 默认安装到C:\Program Files (x86)\windows_exporter目录。
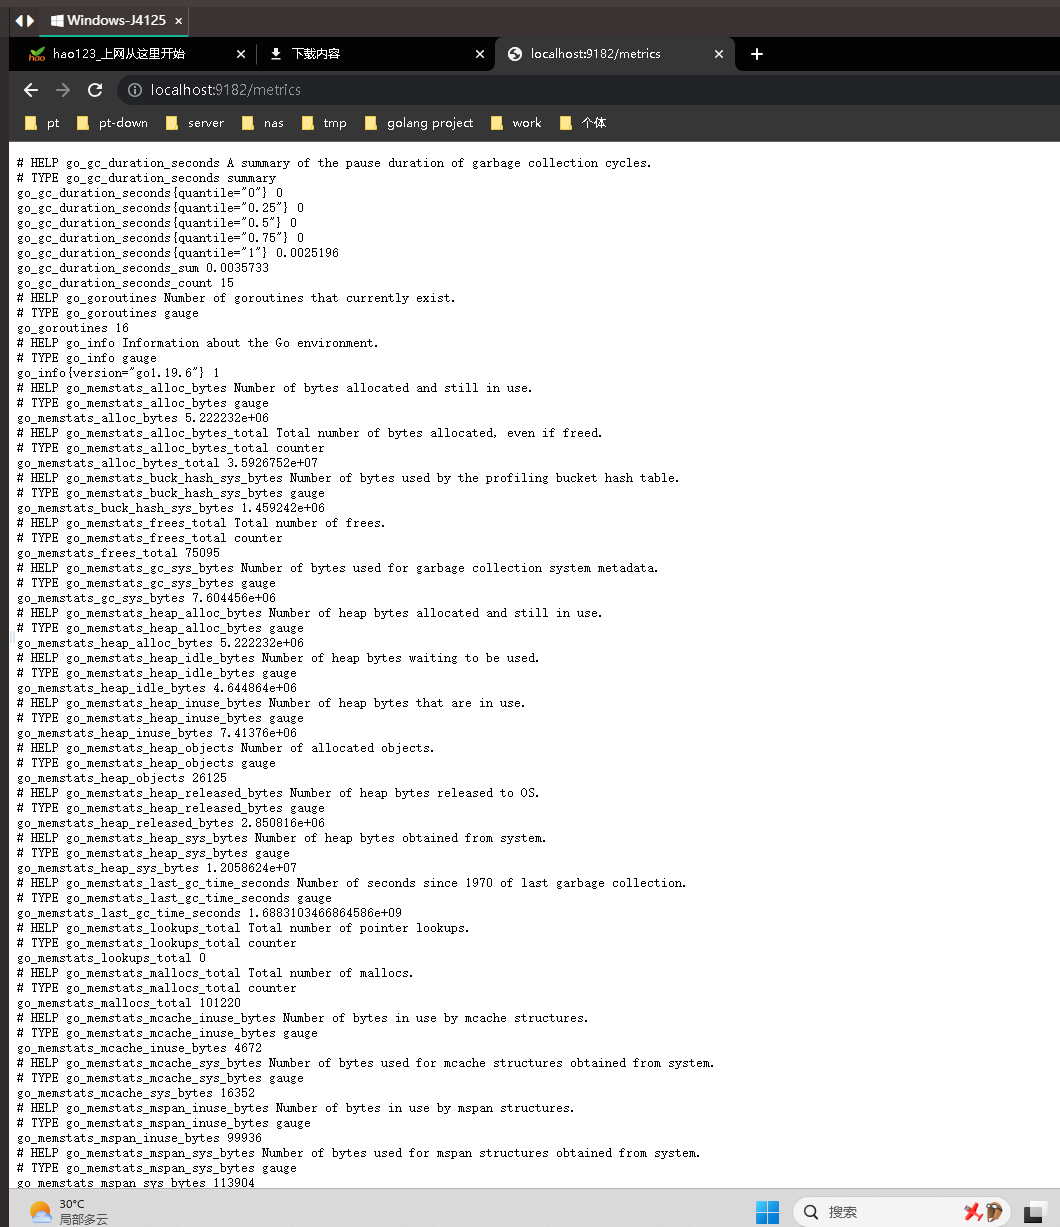
- 默认监听端口是9182。
- 默认采集指标:cpu、cpu_info、memory、process、tcp、cs、logical_disk、net、os、system、textfile、time。
安装完成后,可以在Windows服务控制台看到创建的服务。
打开服务
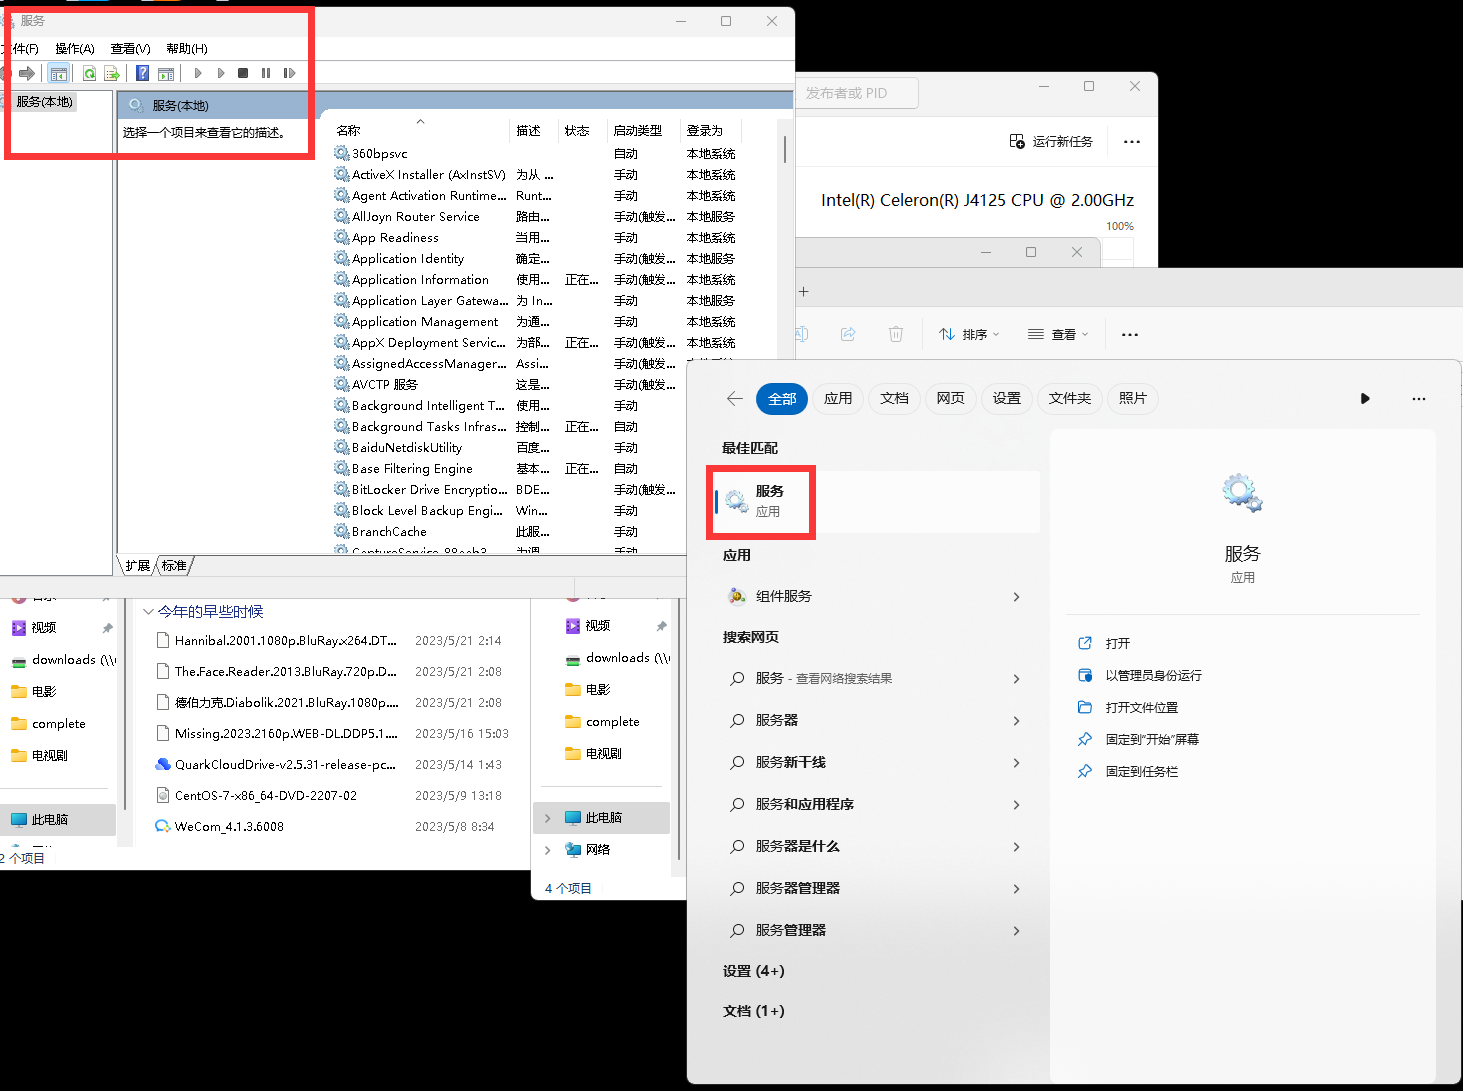
找到Windows exporter
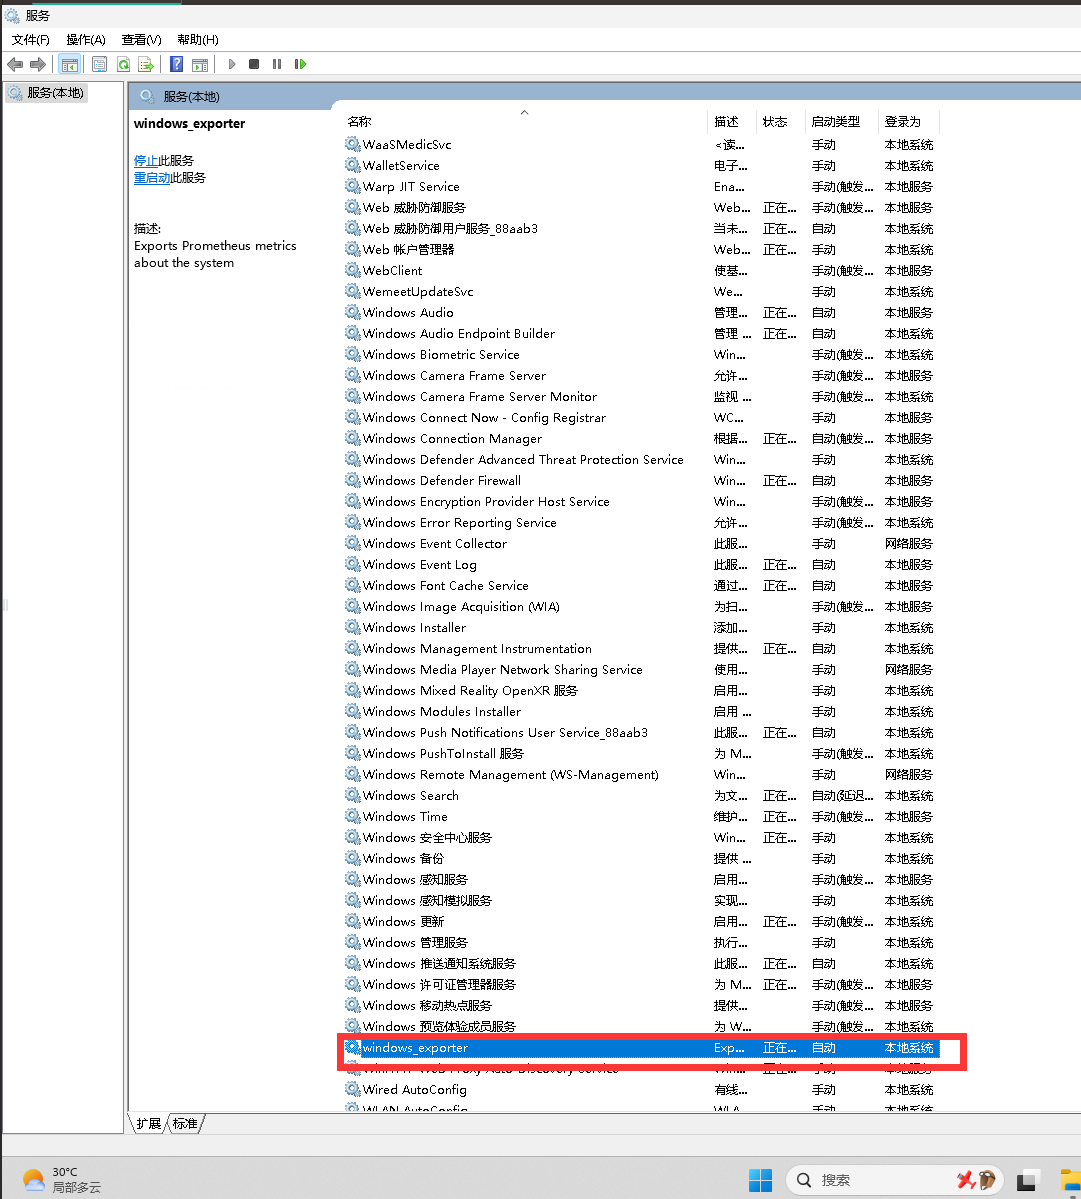
检查服务是否正常
Prometheus 添加监控
  - job_name: 'windowsJ4125_server'
    metrics_path: '/metrics'
    static_configs:
      - targets:
        - 'dsm.frps.cn:9182'

#自行修改为Windows exporter IP
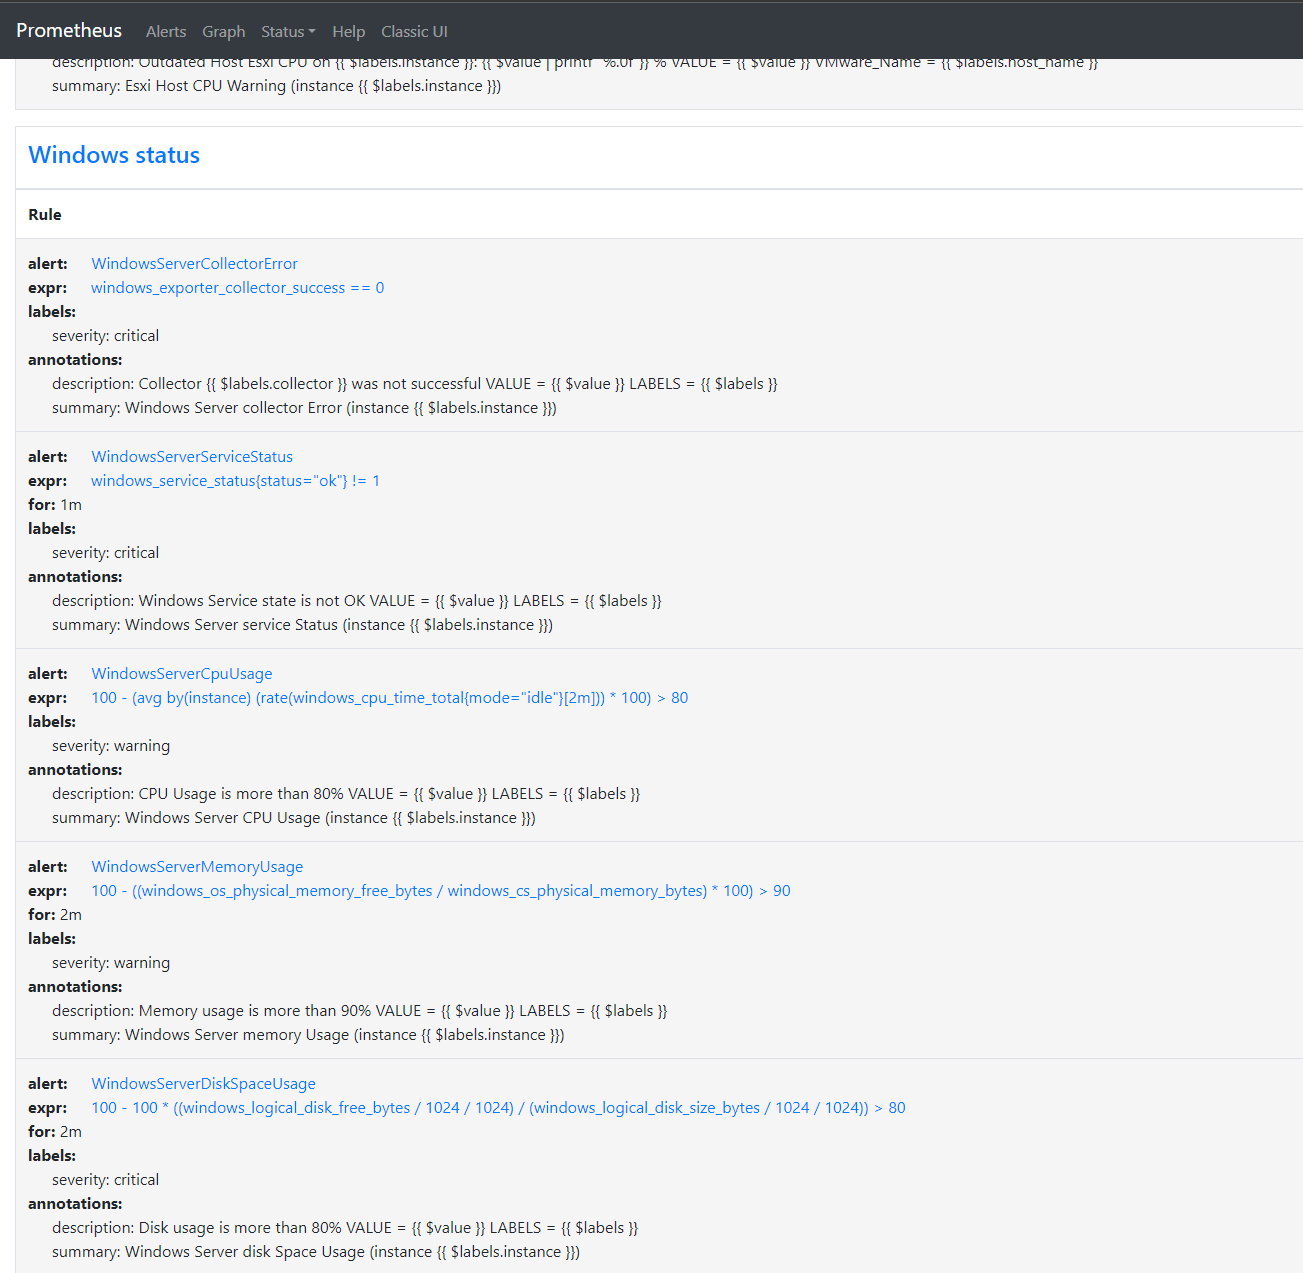
添加Alertmanager rule规则
groups:
    - name: Windows status
      rules:
      - alert: WindowsServerCollectorError
        expr: windows_exporter_collector_success == 0
        for: 0m
        labels:
          severity: critical
        annotations:
          summary: Windows Server collector Error (instance {{ $labels.instance }})
          description: "Collector {{ $labels.collector }} was not successful\n  VALUE = {{ $value }}\n  LABELS = {{ $labels }}"
      - alert: WindowsServerServiceStatus
        expr: windows_service_status{status="ok"} != 1
        for: 1m
        labels:
          severity: critical
        annotations:
          summary: Windows Server service Status (instance {{ $labels.instance }})
          description: "Windows Service state is not OK\n  VALUE = {{ $value }}\n  LABELS = {{ $labels }}"
      - alert: WindowsServerCpuUsage
        expr: 100 - (avg by (instance) (rate(windows_cpu_time_total{mode="idle"}[2m])) * 100) > 80
        for: 0m
        labels:
          severity: warning
        annotations:
          summary: Windows Server CPU Usage (instance {{ $labels.instance }})
          description: "CPU Usage is more than 80%\n  VALUE = {{ $value }}\n  LABELS = {{ $labels }}"
      - alert: WindowsServerMemoryUsage
        expr: 100 - ((windows_os_physical_memory_free_bytes / windows_cs_physical_memory_bytes) * 100) > 90
        for: 2m
        labels:
          severity: warning
        annotations:
          summary: Windows Server memory Usage (instance {{ $labels.instance }})
          description: "Memory usage is more than 90%\n  VALUE = {{ $value }}\n  LABELS = {{ $labels }}"
      - alert: WindowsServerDiskSpaceUsage
        expr: 100.0 - 100 * ((windows_logical_disk_free_bytes / 1024 / 1024 ) / (windows_logical_disk_size_bytes / 1024 / 1024)) > 80
        for: 2m
        labels:
          severity: critical
        annotations:
          summary: Windows Server disk Space Usage (instance {{ $labels.instance }})
          description: "Disk usage is more than 80%\n  VALUE = {{ $value }}\n  LABELS = {{ $labels }}"
重启Prometheus和alertmanager
[root@prometheus rules]# docker restart alertmanager
alertmanager
[root@prometheus rules]# docker restart prometheus_new
prometheus_new
[root@prometheus rules]#
此时Windows exporter规则已经添加完毕
Grafana视图添加
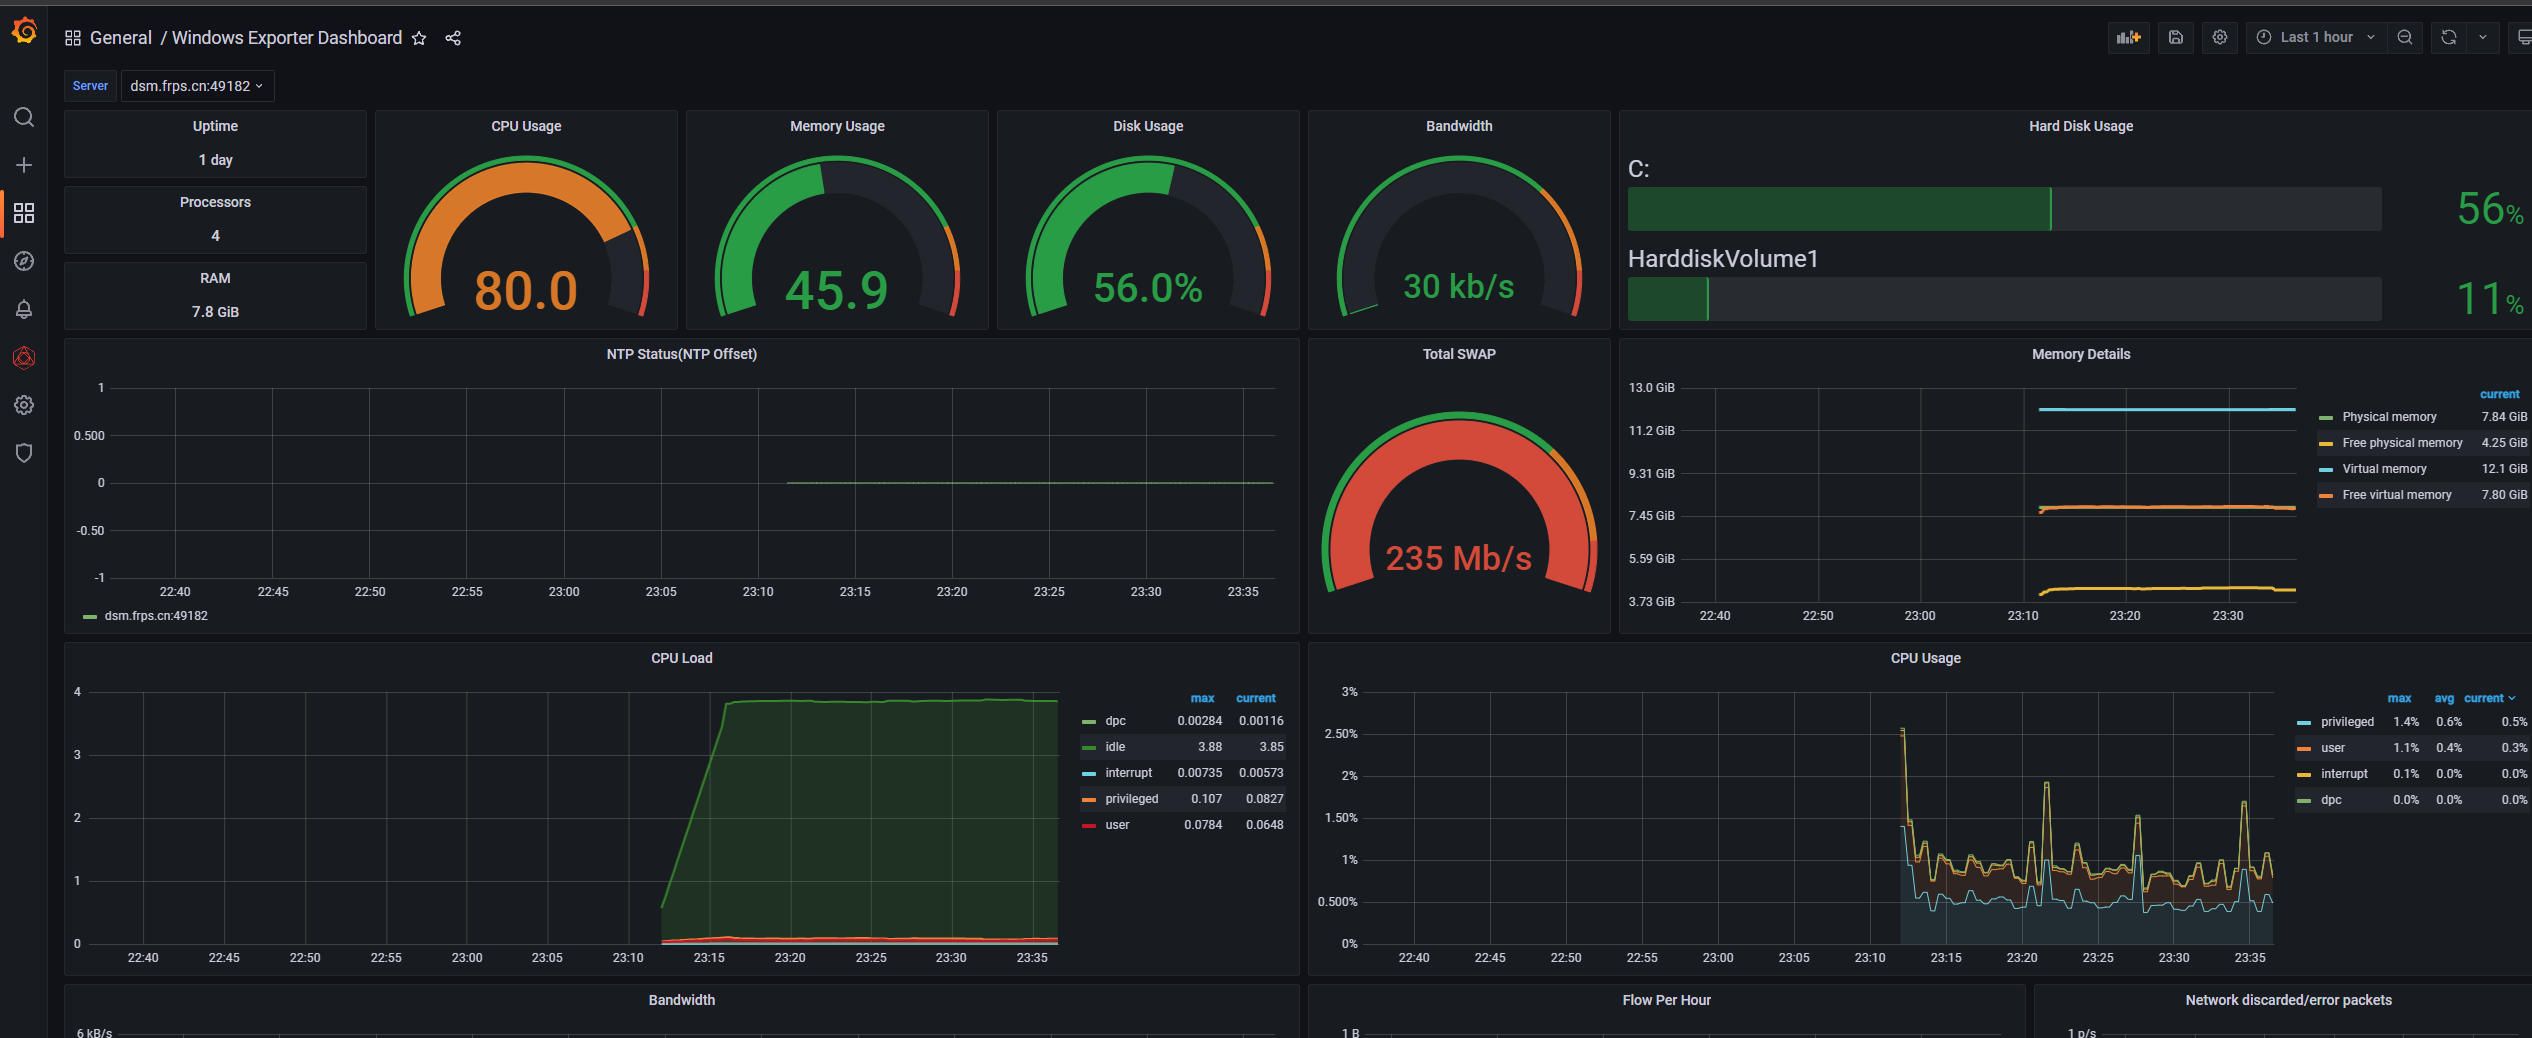
这里直接导入下面模板即可
14694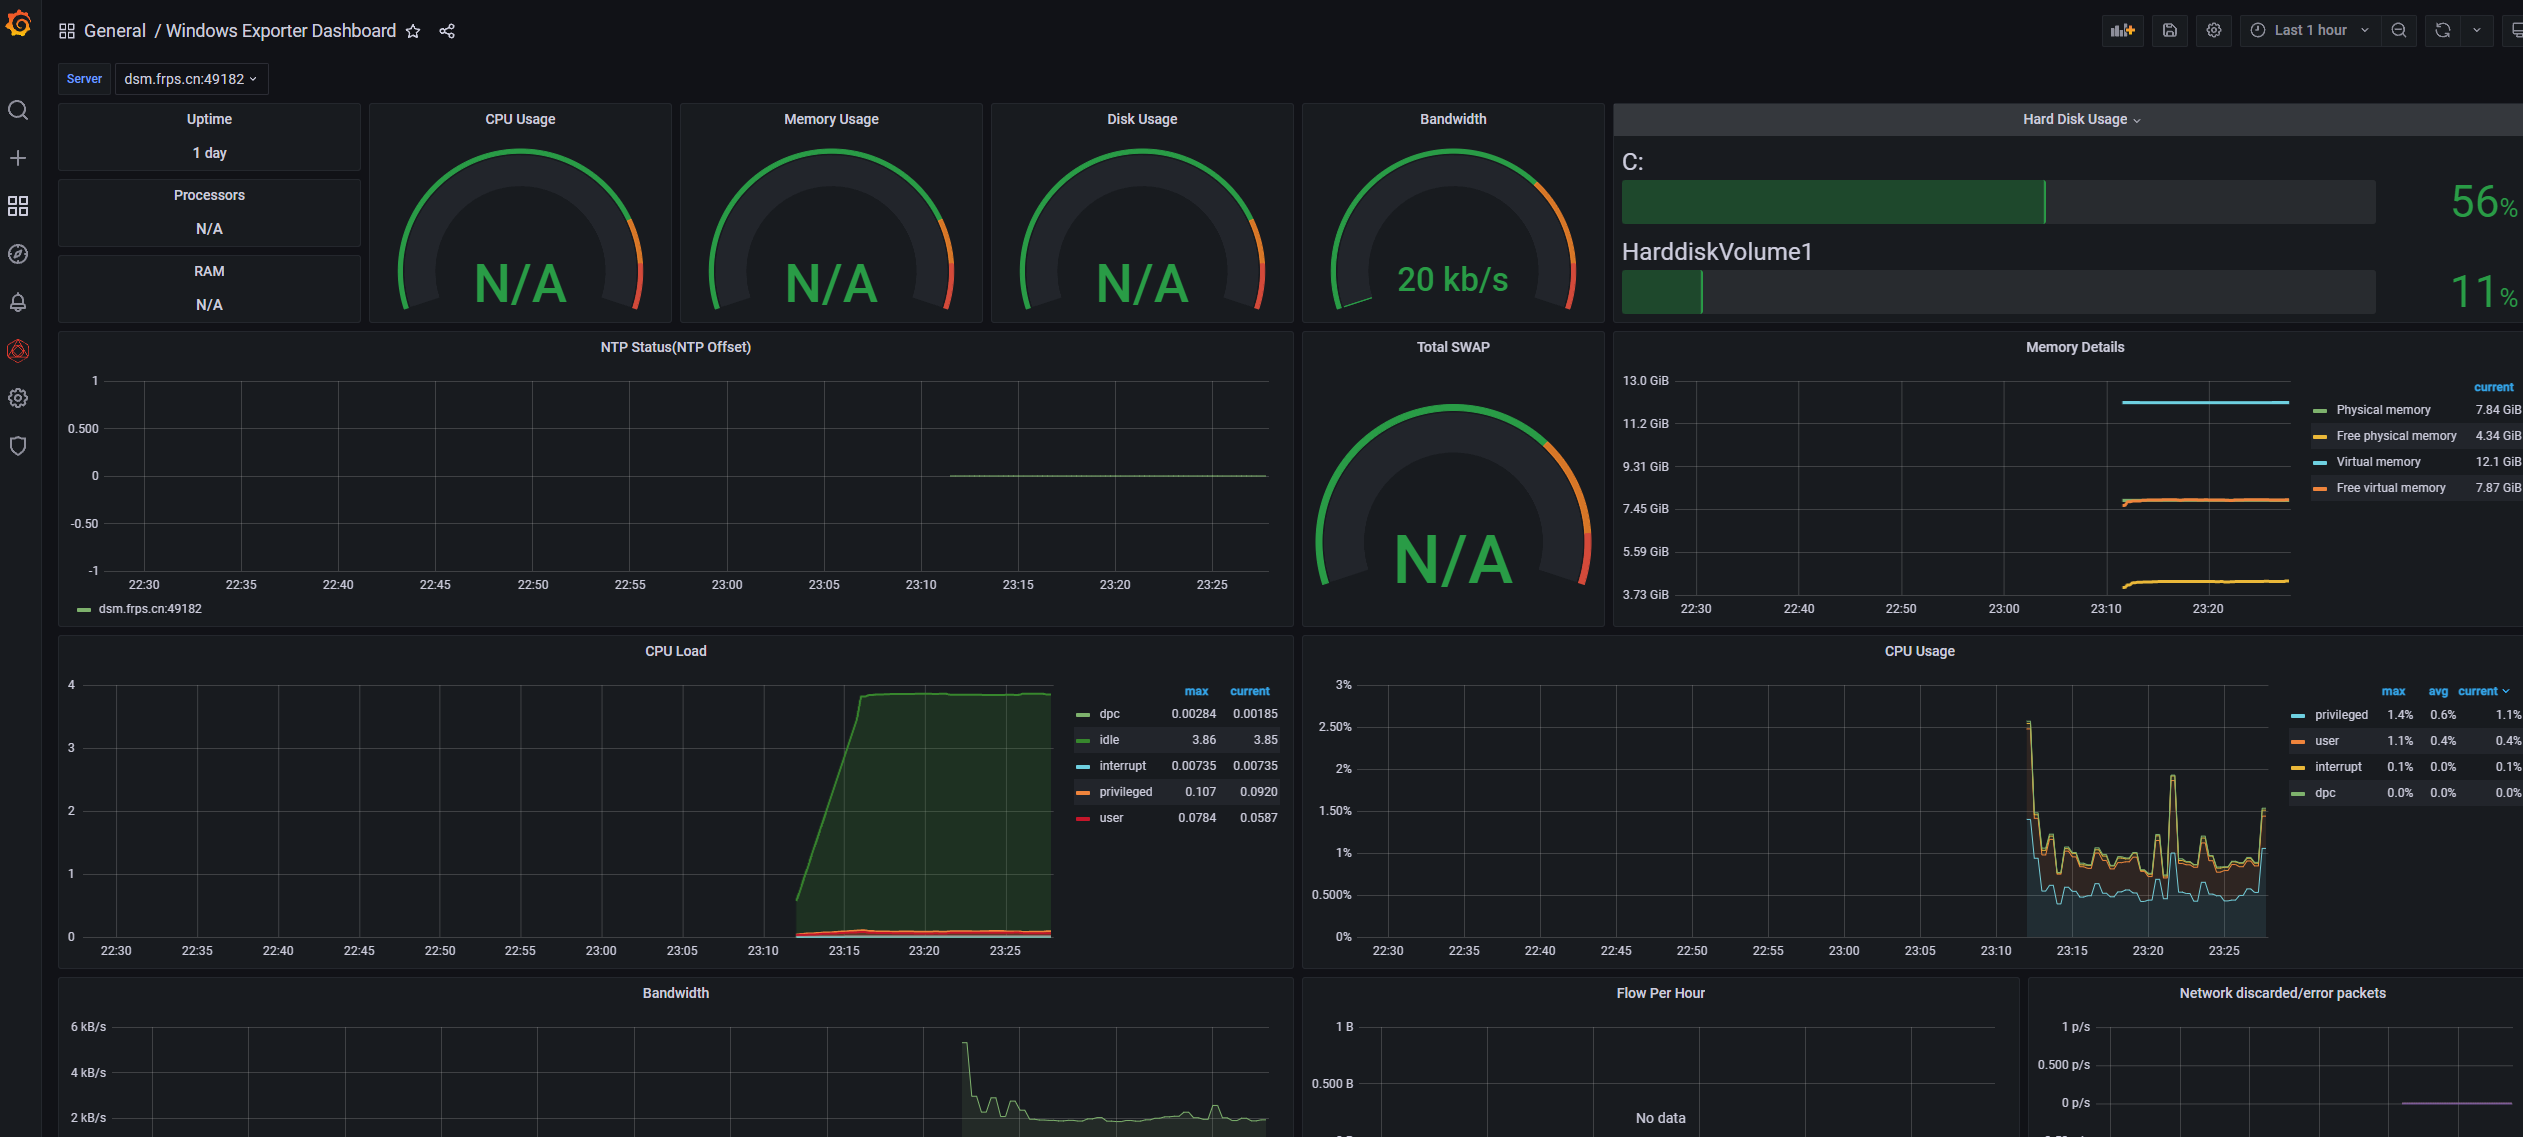
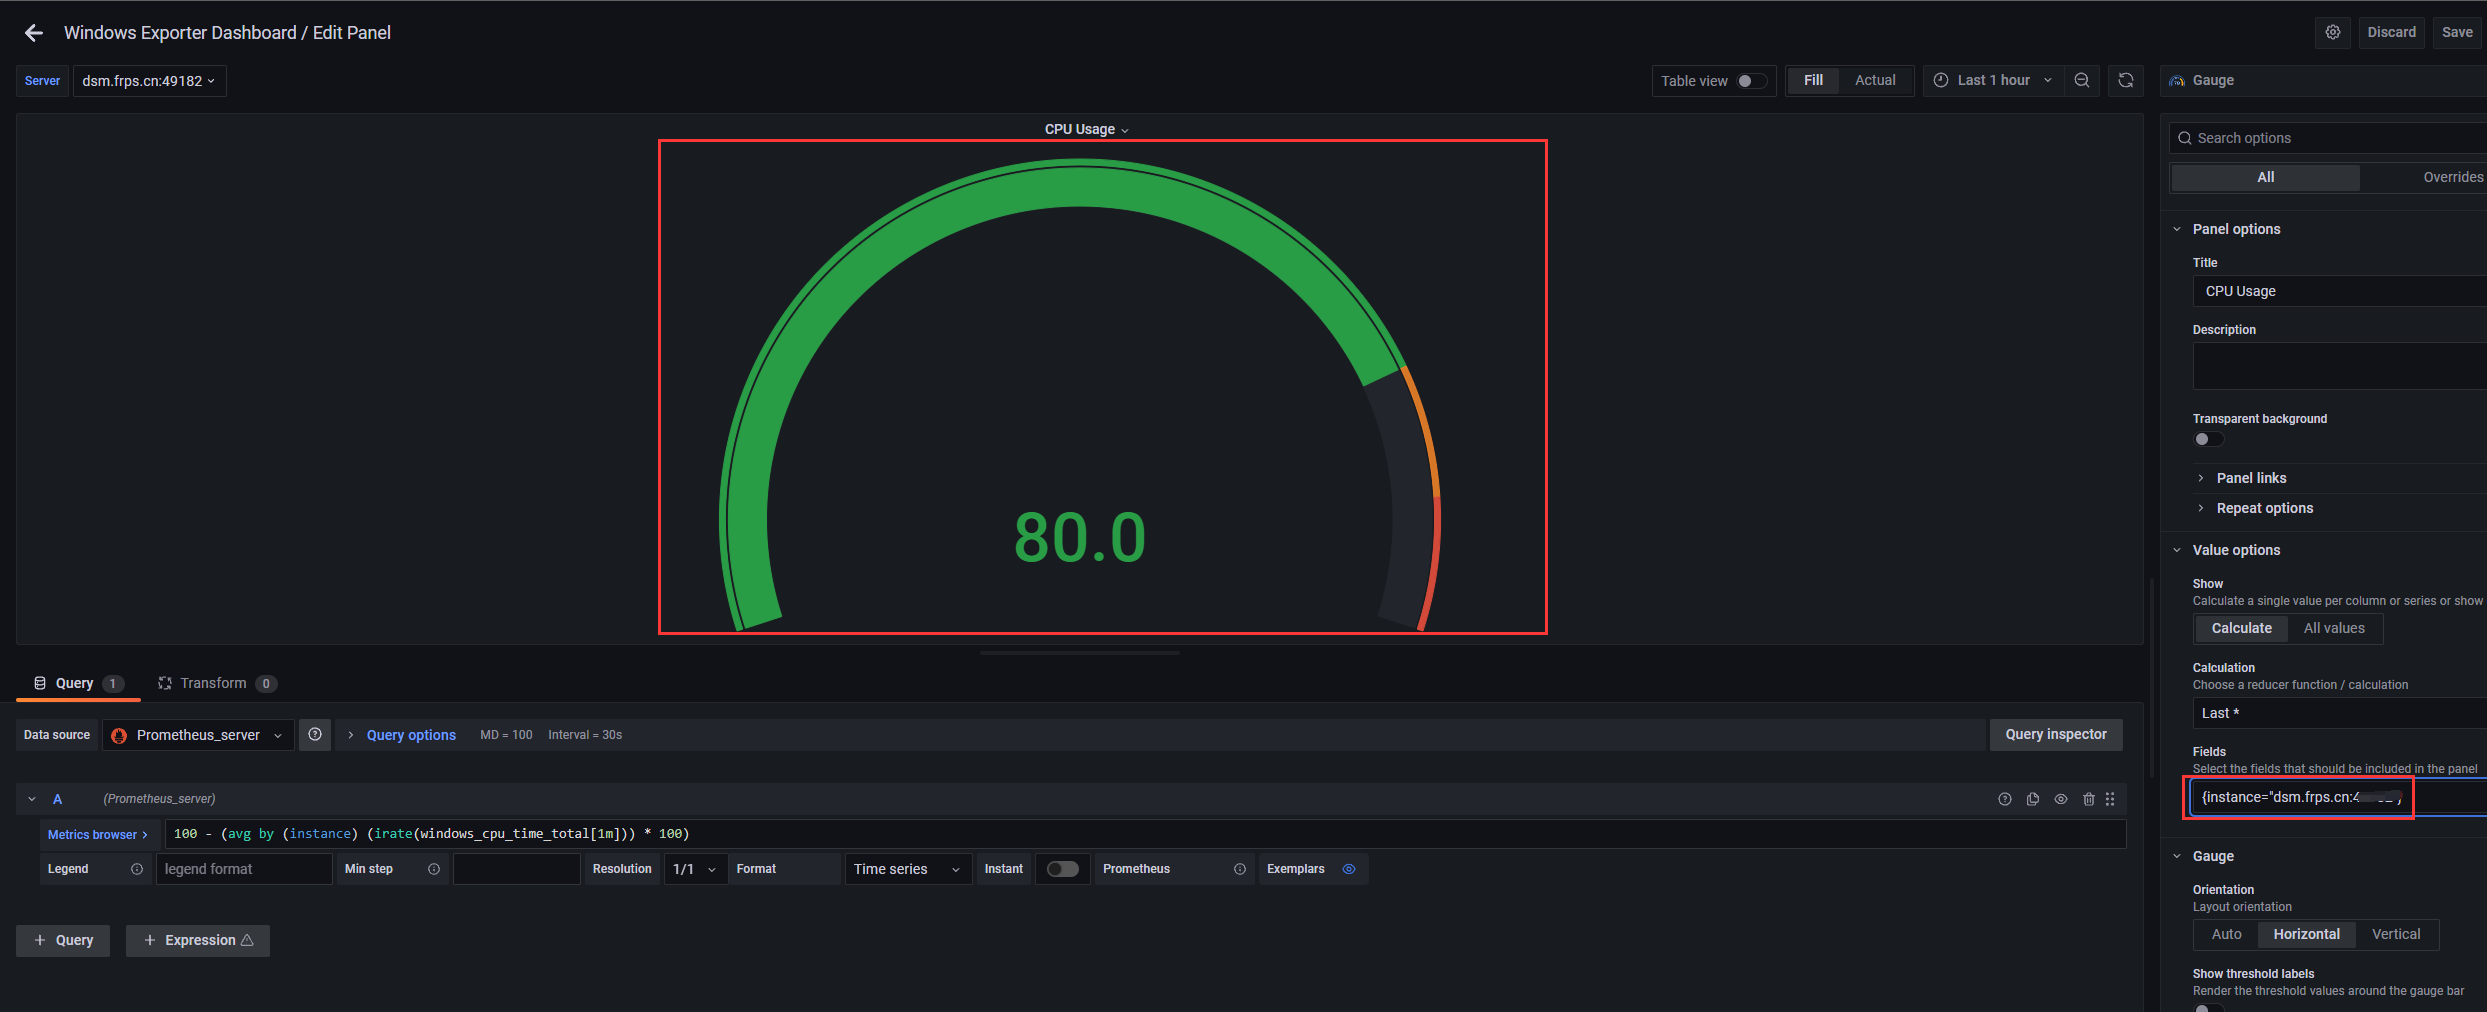
如果这个模板有的地方没有数据,请修改grafana配置
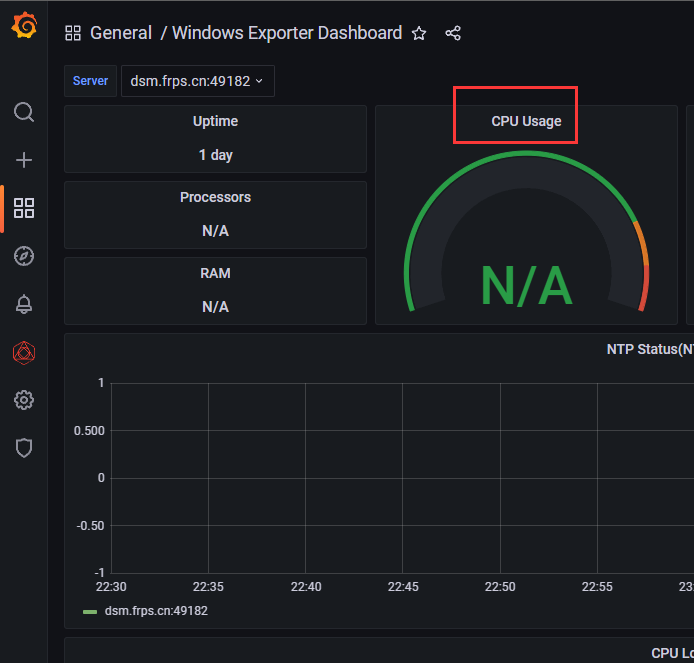
选择编辑
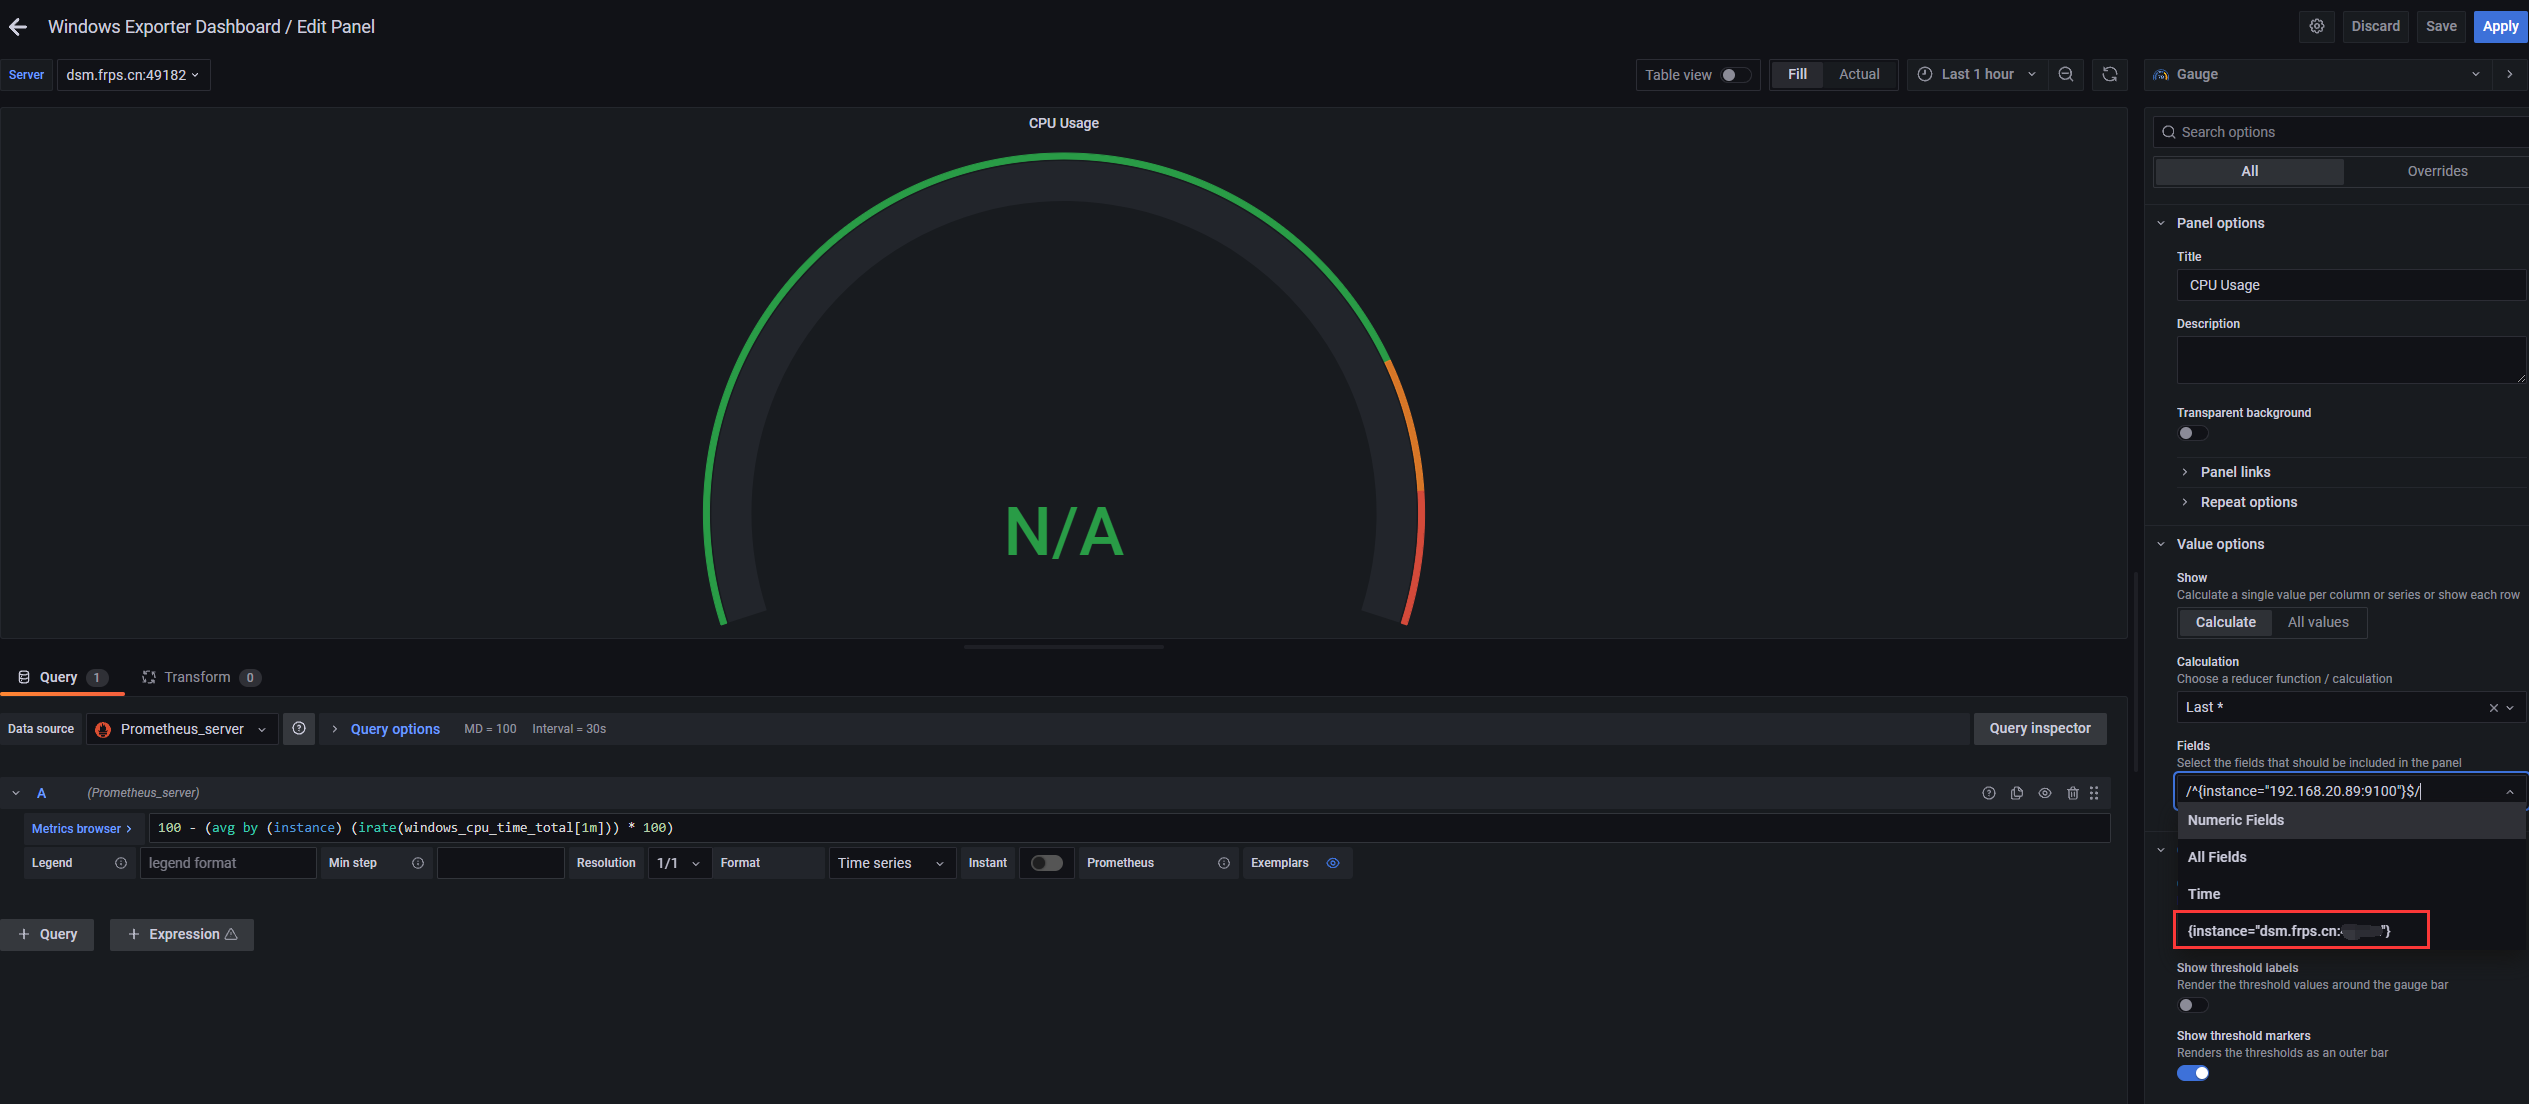
此时就有数据了